Analytics Query Tool
The ShufflePoint Analytics Query Tool is built on the Analytics Query Language (AQL), and is used to create refreshable Excel documents. It is also used to generate Google Chart/Visualization data source URLs. See the Quick Start Guides below for details.
The Analytics Query Tool has four main work areas or panels, one of which is a tabbed panel.
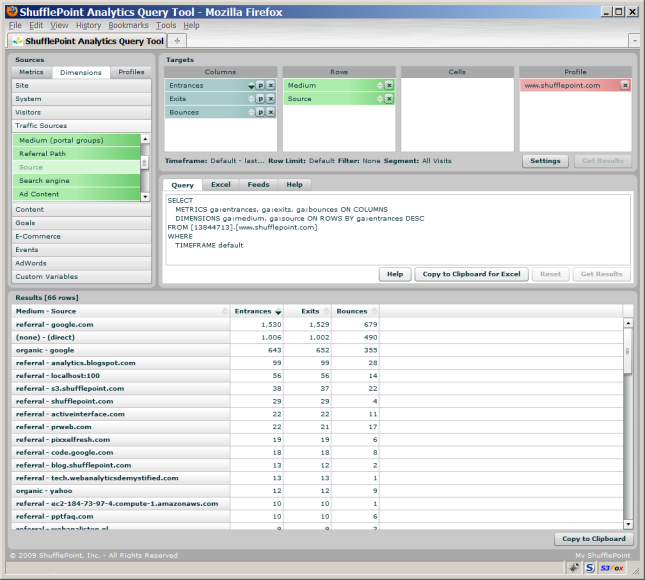
Sources
The panel on the left contains the drag-and-drop “Sources”. The possible sources are categorized as “Metrics”, “Dimensions”, and “Profiles”. The sources are drag-and-dropped onto the target lists described below.
Targets
The panel at the top right contains the drag-and-drop “Targets”. The possible targets are “Columns”, “Rows”, “Cells”, and “Profiles”. This panel also contains settings for the query “Timeframe” and “Row” limit.
Results
The panel at the bottom contains a grid with the query results. The options available depend on how
the query tool is being used.
Tab Panel
Query Tab
Click on the Query tab to view or modify the query. See Query for more details.
Excel Tab
The Excel tab used to download IQY files. See Excel IQY Files for more details.
Feeds Tab
The Feeds tab used for generating Google Chart Tool (Visualization) data sources and URLs to feed Google Charts, Google Maps, and Google Earth. See Feed Generation for more details.
Help Tab
The Help tab contains brief instructions on the use of the Analytics Query Tool.